Invent Analytics

What is the problem?
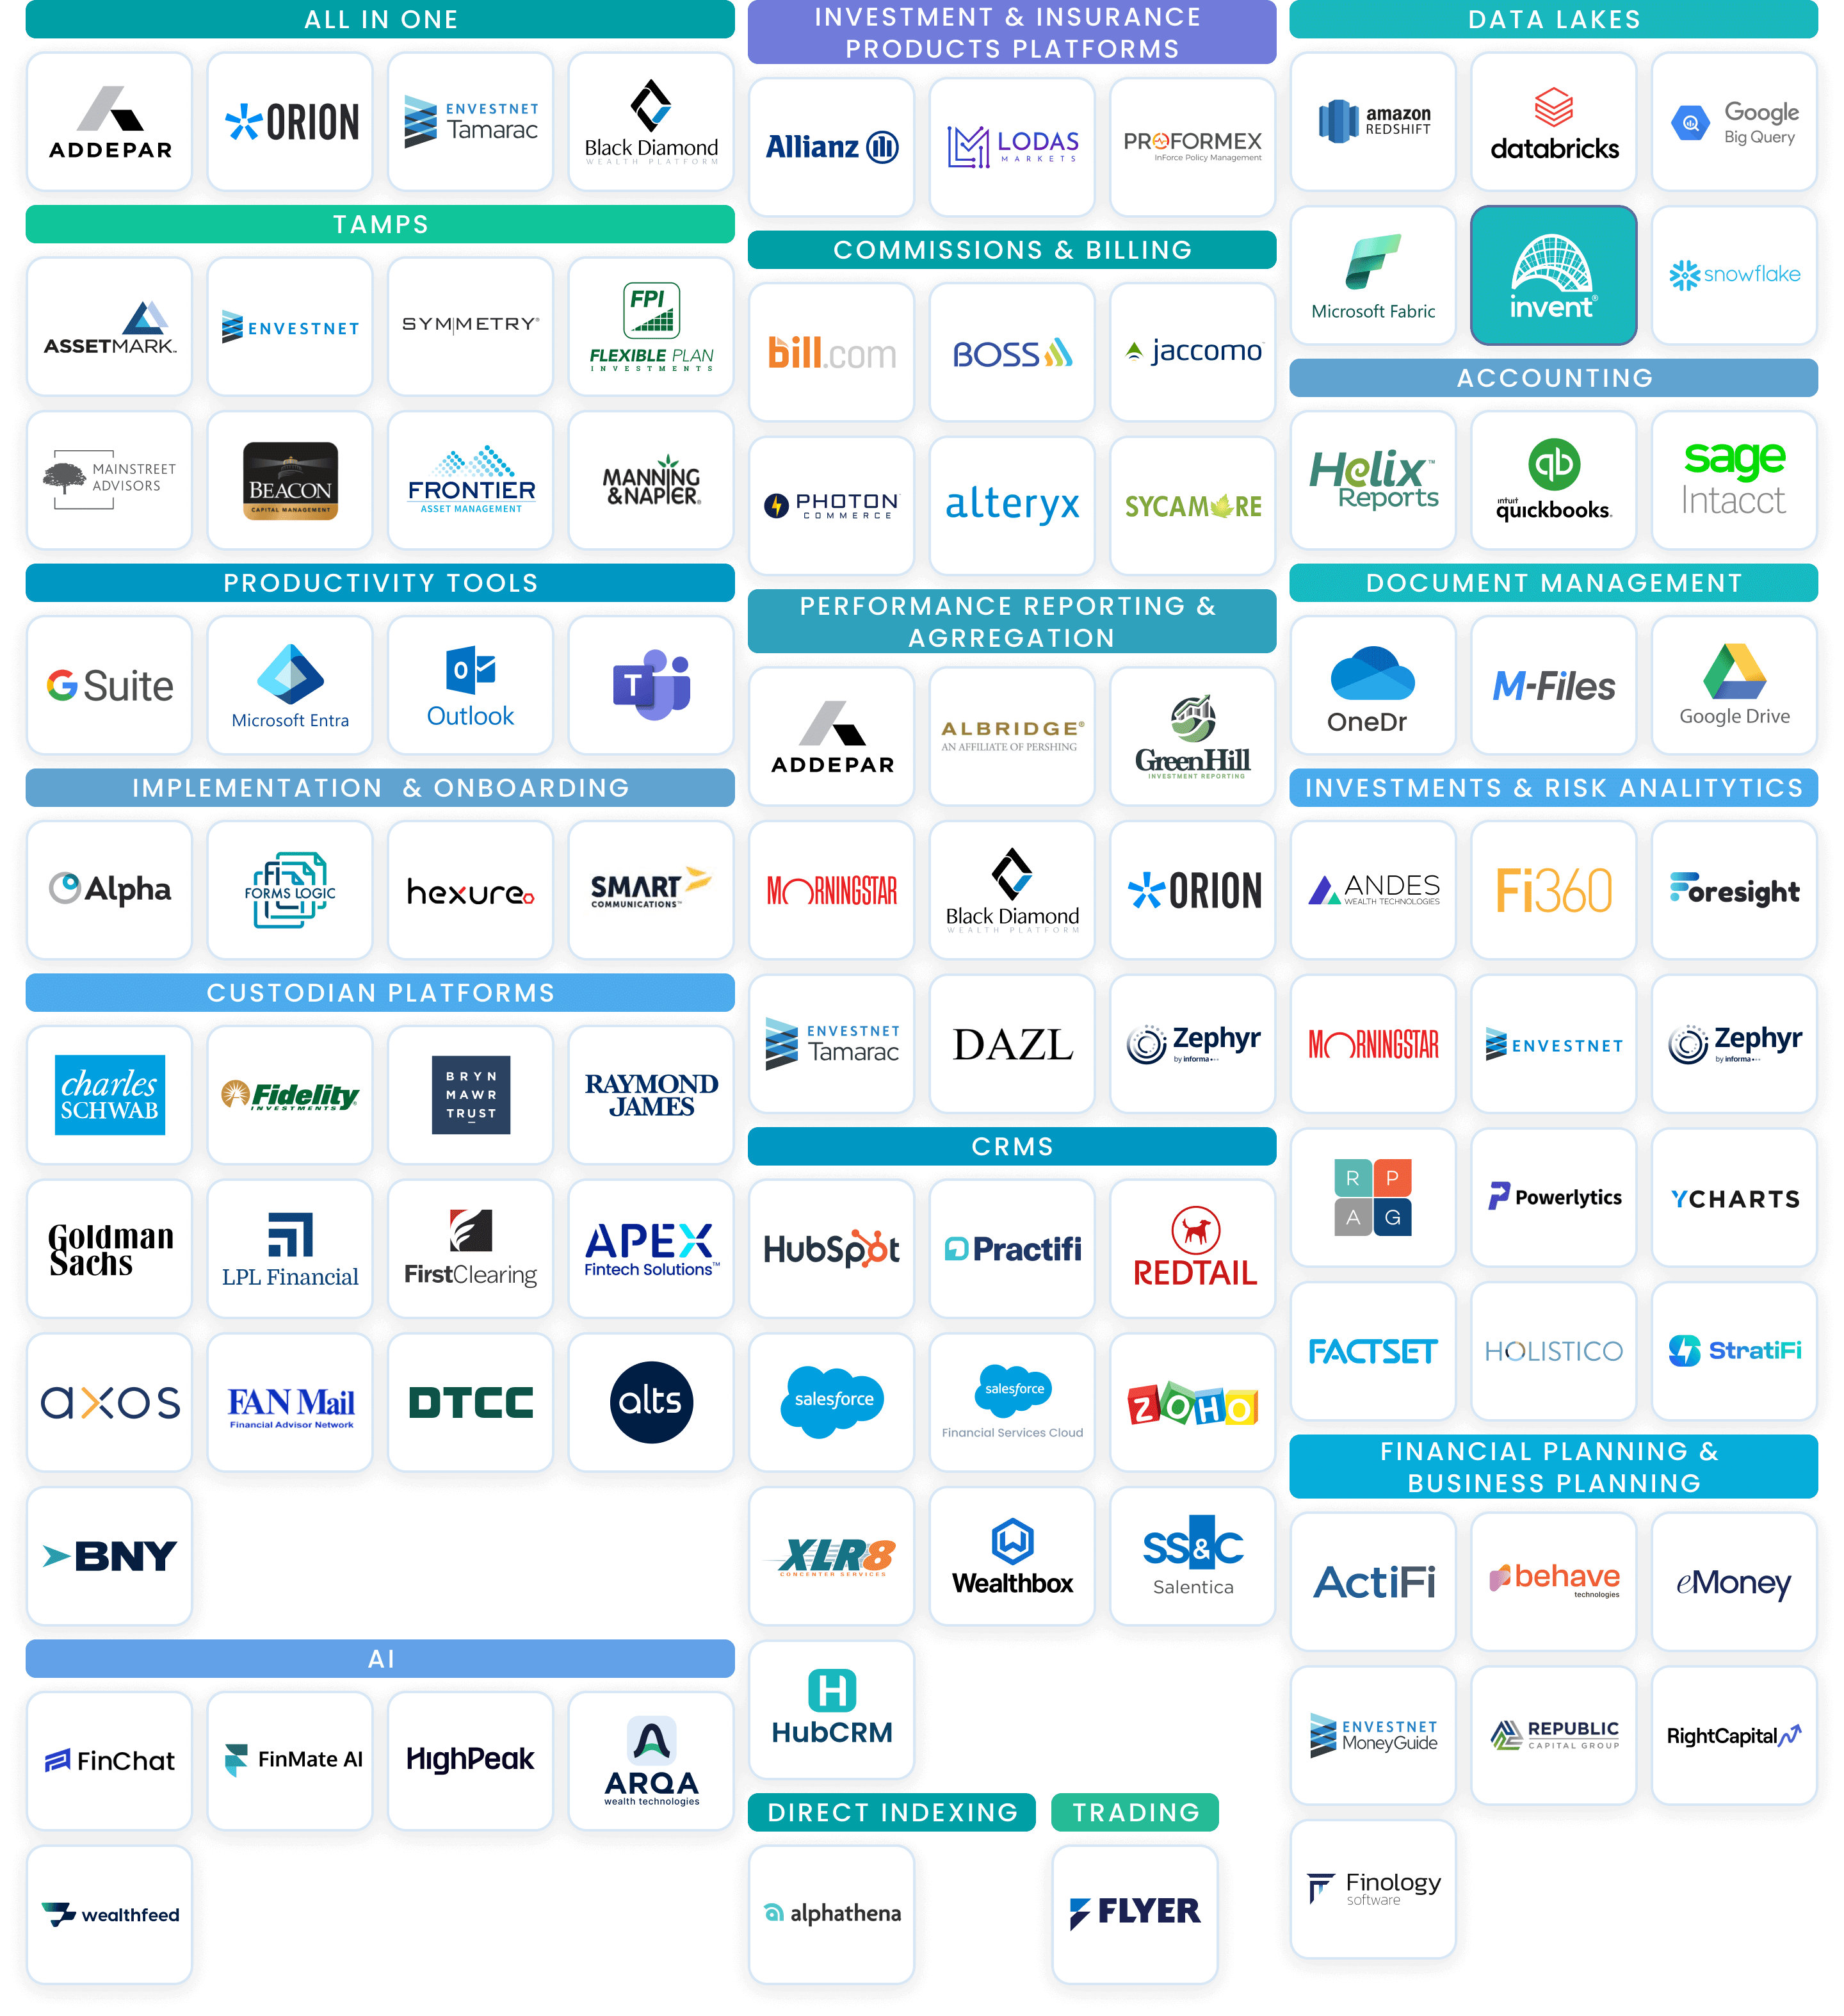
In wealth management, fragmented data leads to conflicting reports, misaligned teams, and poor decisions.
Client information might live in a CRM, account balances in a custodian platform, insurance data in a policy system, and revenue insights in spreadsheets. Without unification, the risk of reporting errors, duplicated work, and compliance gaps is high.
How Do We Solve It
INVENT solves this with a true Single Source of Truth. Powered by a modern Data Lakehouse and Data Vault 2.0, INVENT consolidates structured and unstructured data from all relevant systems—CRMs, custodians, financial planning tools, onboarding systems, policy apps, and more — into one unified, governed, and historically accurate data layer.
How It Works
Designed to support both technical analysts and front-office business users, INVENT empowers advisors, compliance officers, and executives to explore data, build personalized dashboards, and uncover actionable insights—without waiting on a centralized data team.
From tracking AUM flows and advisor productivity to monitoring onboarding, compliance, and client segmentation, INVENT Analytics delivers the visibility firms need to drive growth, reduce risk, and operate with confidence in a fast-moving regulatory environment.
INVENT delivers unified, end-to-end insights across all applications and critical areas of your business operations, including:
- AUM flows and revenue trends
- Multi-custodian performance
- Advisor productivity and compensation
- Regulatory compliance metrics (Reg BI, SEC, AML/KYC)
- Onboarding pipeline and case status tracking
- Policy and wealth application statuses

What This Means for You
Key Benefits of INVENT Analytics

Consolidate structured and unstructured data from CRMs, custodians, planning tools, and policy platforms into one trusted platform.
Benefit: Make fast, confident decisions based on consistent, reconciled, and high-integrity data.

Enable advisors, operations, compliance, and executives to explore data, build dashboards, and answer questions—without coding.
Benefit: Reduce dependence on central data teams and accelerate time to insight across the firm.
Key Features
-
No-Code Visualization Builder
- Easily create charts and dashboards using a drag-and-drop interface.
- Supports a wide range of chart types (bar, pie, line, heatmaps, treemaps, sunburst, funnel, etc.) without requiring coding skills.
-
Role-Based Access Control (RBAC)
- Granular user access controls for dashboards, datasets, and queries.
- Ensures compliance and data privacy across departments (e.g., advisors, compliance officers, executives).
-
Interactive Dashboards
- Filterable, real-time dashboards that support cross-filtering, drill-downs, and dynamic interactivity.
- Ideal for tracking AUM, account flows, onboarding statuses, and advisor productivity in wealth management.


SQL IDE for Power Users
- Built-in SQL editor with syntax highlighting, autocomplete, and query history.
- Allows data analysts to write, test, and visualize custom queries directly.

-
Multi-Datasource Connectivity
- Connects to most modern databases and data engines (e.g., Trino, PostgreSQL, Snowflake, BigQuery, MySQL, Presto, and more).
- Seamlessly integrates with INVENT’s Data Lakehouse and federated data layer.
-
Embedded Analytics
- Dashboards and charts can be embedded into external platforms or portals (e.g., INVENT Experience Builder).
- Enables client-facing analytics, producer portals, and custom reporting views.
-
Performance & Scalability
- Supports caching, async queries, and load balancing for large-scale deployments.
- Ideal for handling analytics across thousands of advisors and millions of client records.